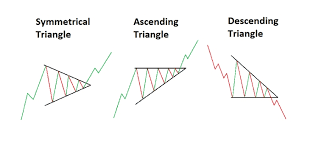
In the world of trading, understanding technical patterns can be a key to success. One of the patterns frequently used by traders is the Triangle Pattern. This article will delve into the importance of the Triangle Pattern in trading, its various types, and the potential impact when such a pattern forms. We will discuss the three main types of Triangle Patterns: Symmetrical Triangle, Ascending Triangle, and Descending Triangle. Additionally, we will explore how to ensure the validity of these patterns.
Symmetrical Triangle
- The Symmetrical Triangle is a pattern where the resistance line (connecting the peaks of price) and the support line (connecting the price troughs) converge at a single point. This pattern usually appears when there is balanced pressure between buyers and sellers, causing the price to move within a narrowing range. This phenomenon reflects a consolidation phase in the market, where buying and selling forces are in equilibrium.
- The main impact of a Symmetrical Triangle is the potential for a significant breakout, either upwards or downwards. This pattern is often considered a continuation pattern, meaning that the price tends to continue its previous trend after a breakout occurs. As a trader, it is crucial to monitor trading volume during the formation of this pattern, as an increase in volume typically confirms the potential for a breakout.
Ascending Triangle
- The Ascending Triangle forms when there is a horizontal resistance line at the top and an upward-sloping support line at the bottom, overall forming a triangle. This pattern indicates that buying pressure is increasing, while the price is held at a certain resistance level. If the price manages to break through this resistance level, the pattern is considered a bullish signal, with the price likely to move higher.
- The Ascending Triangle is also part of the continuation pattern group, indicating that the price is likely to continue its prior uptrend. Traders often use this pattern as a signal to enter a buy position, especially when the resistance breakout occurs with high volume.
Descending Triangle
- The Descending Triangle is the opposite of the Ascending Triangle. In this pattern, a horizontal support line forms at the bottom, while the resistance line slopes downward, reflecting increasing selling pressure. This pattern indicates that sellers are beginning to dominate the market, and there is a possibility that the price will break through the support level.
- Like the Ascending Triangle, the Descending Triangle is also categorized as a continuation pattern. When the price breaks the support level with high volume, it can signal an entry point for a sell position, as the price is likely to continue its previous downtrend.
Ensuring the Validity of Triangle Patterns
To ensure that a Triangle Pattern is valid, consider the following:
- Volume: A valid pattern is often followed by an increase in volume at the time of the breakout.
- Formation Duration: The longer it takes for the pattern to form, the stronger the signal it typically generates.
- Confirmation: A breakout should ideally be confirmed by a candle closing outside the support or resistance line.
Mastering these three types of Triangle Patterns is crucial to enhancing your potential profits in trading. By understanding the characteristics of each pattern and how to confirm their validity, you can make smarter trading decisions and maximize your portfolio. Always remember to keep learning and stay motivated in your trading journey!


.png)
.png)
.png)
.png)


