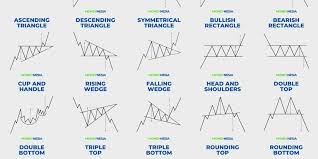
In a previous article, I discussed chart patterns in general, covering their definitions, functions, and types. This time, we'll focus on one of the key types of chart patterns: Continuation Chart Patterns.
Definition of Continuation Chart Patterns
According to Edianto Ong, a Continuation Chart Pattern indicates a normal correction in a trend or a temporary pause, where the trend is expected to continue afterward. Simply put, a Continuation Chart Pattern is a pause during an ongoing trend, whether upward or downward. When a price pattern forms and follows the trend, it is known as a continuation pattern.
This pattern signals that prices are likely to continue the previous trend after a temporary pause or correction. As a result, after the pattern forms, you can open a position in the direction of the main trend. For example, if the EUR/USD currency pair is trending down and you identify a Continuation Chart Pattern, you can open a sell position.
Types of Continuation Chart Patterns
There are several common types of Continuation Chart Patterns used in technical analysis, including:
- Triangles Chart PatternsTriangles are continuation patterns formed by narrowing price fluctuations. This pattern consists of two lines (support and resistance) that meet on the right, forming a triangle. There are three types of triangles:
- Symmetrical Triangle: Forms when the support and resistance lines converge with equal slopes.
- Ascending Triangle: Occurs when the resistance line is flat, and the support line rises.
- Descending Triangle: Forms when the support line is flat, and the resistance line declines.
Triangle patterns are often used by traders to understand market conditions and predict whether the price trend will continue, stay the same, or reverse.
- Pennants Chart PatternsPennants are among the most common Continuation Chart Patterns, illustrating a brief pause in a very dynamic trend. This pattern appears after a sharp price movement in a short period. There are two types of pennants:
- Bullish Pennants: Start with an uptrend.
- Bearish Pennants: Start with a downtrend.
- Flag Chart PatternsFlags share many similarities with pennants. Both appear in the same places within very dynamic trends. This pattern resembles a flag, where the pole represents a steep price trend over a short period, and the flag represents a small correction before the trend continues in its original direction. Flags help traders determine the optimal time to enter the market.
- Wedges Chart PatternsThe Rising Wedge is one of the most popular reversal patterns and is easy to identify. It forms when prices consolidate between an upward-sloping support and resistance line, where the support line has a steeper slope than the resistance line. Wedges provide clues about the next price direction and movement distance, making them favored by many traders.
- Rectangle Chart PatternsRectangle Chart Patterns, or box patterns, occur when prices move within a range between parallel support and resistance levels. This pattern is also known as a trading range, consolidation zone, or box pattern. A rectangle pattern indicates that prices are unable to break through the support and resistance levels and continue to move back and forth between the two.
How Continuation Chart Patterns Work
These continuation patterns work by signaling that the existing trend will continue after a temporary pause or correction. Once the pattern is fully formed, prices tend to revert to the main trend. Traders can use these patterns to identify trading opportunities that align with the main trend, increasing the probability of successful trades.
By having a solid understanding of Continuation Chart Patterns, you can more effectively follow and capitalize on market trends to maximize profits.

